L&_P Traceability And Analysis System
Increase the productivity of your manufacturing with LPTA²S!
With more than 30 years of experience in the construc-tion of special machines and 15 years of experience in the programming of traceability systems, we at L&_P know what is important in production optimization.
We have the know-how to achieve more productivity, transparency, quality and control in your production.

Various end-of-line testers from L&_P with LPTA²S connection
The highlights
- Simple and fast integration / connection of existing systems
- Connections to all common control types possible
- No intervention in the machine programming necessary
- Space-saving installation due to a powerful
mini PC - Easy implementation through intelligent and intuitive configuration
- Perform parameterization yourself if required to save costs
- Permanent monitoring of machine status and display of key production figures in real time (OEE, downtimes, cycle times, etc.)
- Detailed shift evaluations, e-mail and MSA reports
- Analysis of measured values, components and product defects with export function
</p>")
Mini PC with the complete software LPTA²S
(Only required if no machine PC is available)
Significance OEE
The OEE-Value (Overall Equipment Effectiveness) indica-tes to what percentage a machine is actually productive. It can be used to determine how much productivity is lost due to downtime, lack of process speed and scrap.
OEE = Quality x Performance x Availability
Bring the OEE value of each of your machines out of hi-ding. Rely on the expertise of L&_P and take the step into the digital future with LPTA²S.

OEE view of LPTA²S_Analysis
SOFTWARE COMPONENTS
-
 With the user friendly LPTA²S_Editor, you can perform the entire configuration for data acquisition yourself. All you need is basic knowledge of PLC programming.
-
 The LPTA²S_Client provides a live view of all important information about the productivity of the machines to the current shift.
-
 The innovative LPTA²S_Analysis application allows you to analyze all recorded process and product data. Keep an overview of your machines and find the bottleneck in the process flow.


LPTA²S_Analysis, Machine-View
With the LPTA²S_Analysis application you can perform different types of analyses. For example, display all possible information (parts status, measured values, faults, installed components, etc.) for a specific part.
Perform detailed analyses of standstills or link different conditions yourself, e.g. to find all NOK
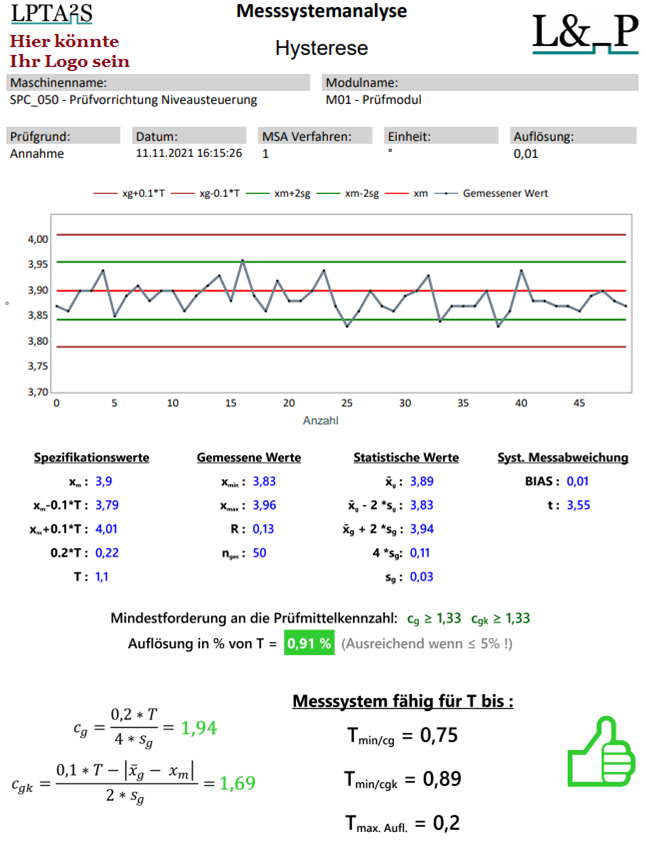
Start an MSA test via the HMI panel and print the report as a PDF with one click using the Analysis app. Bring more quality into your production by this kind of automation and save a lot of work and time.
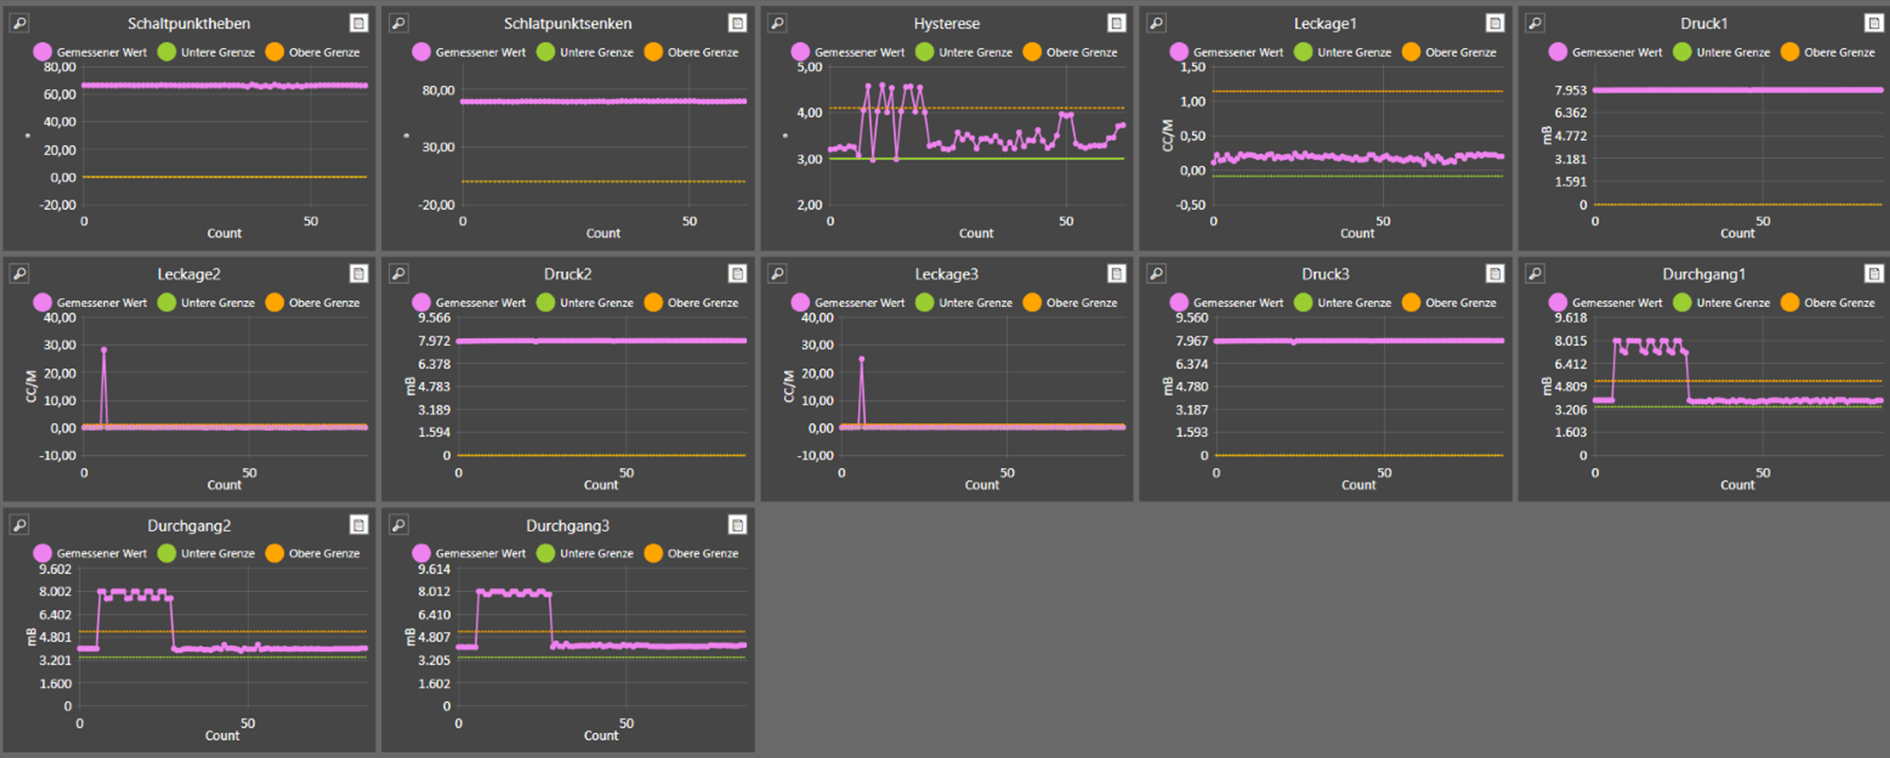
The measured value analysis shows up to 20 diagrams at once. With thousands of different measured values, you can analyze and recognize correlations more quickly.
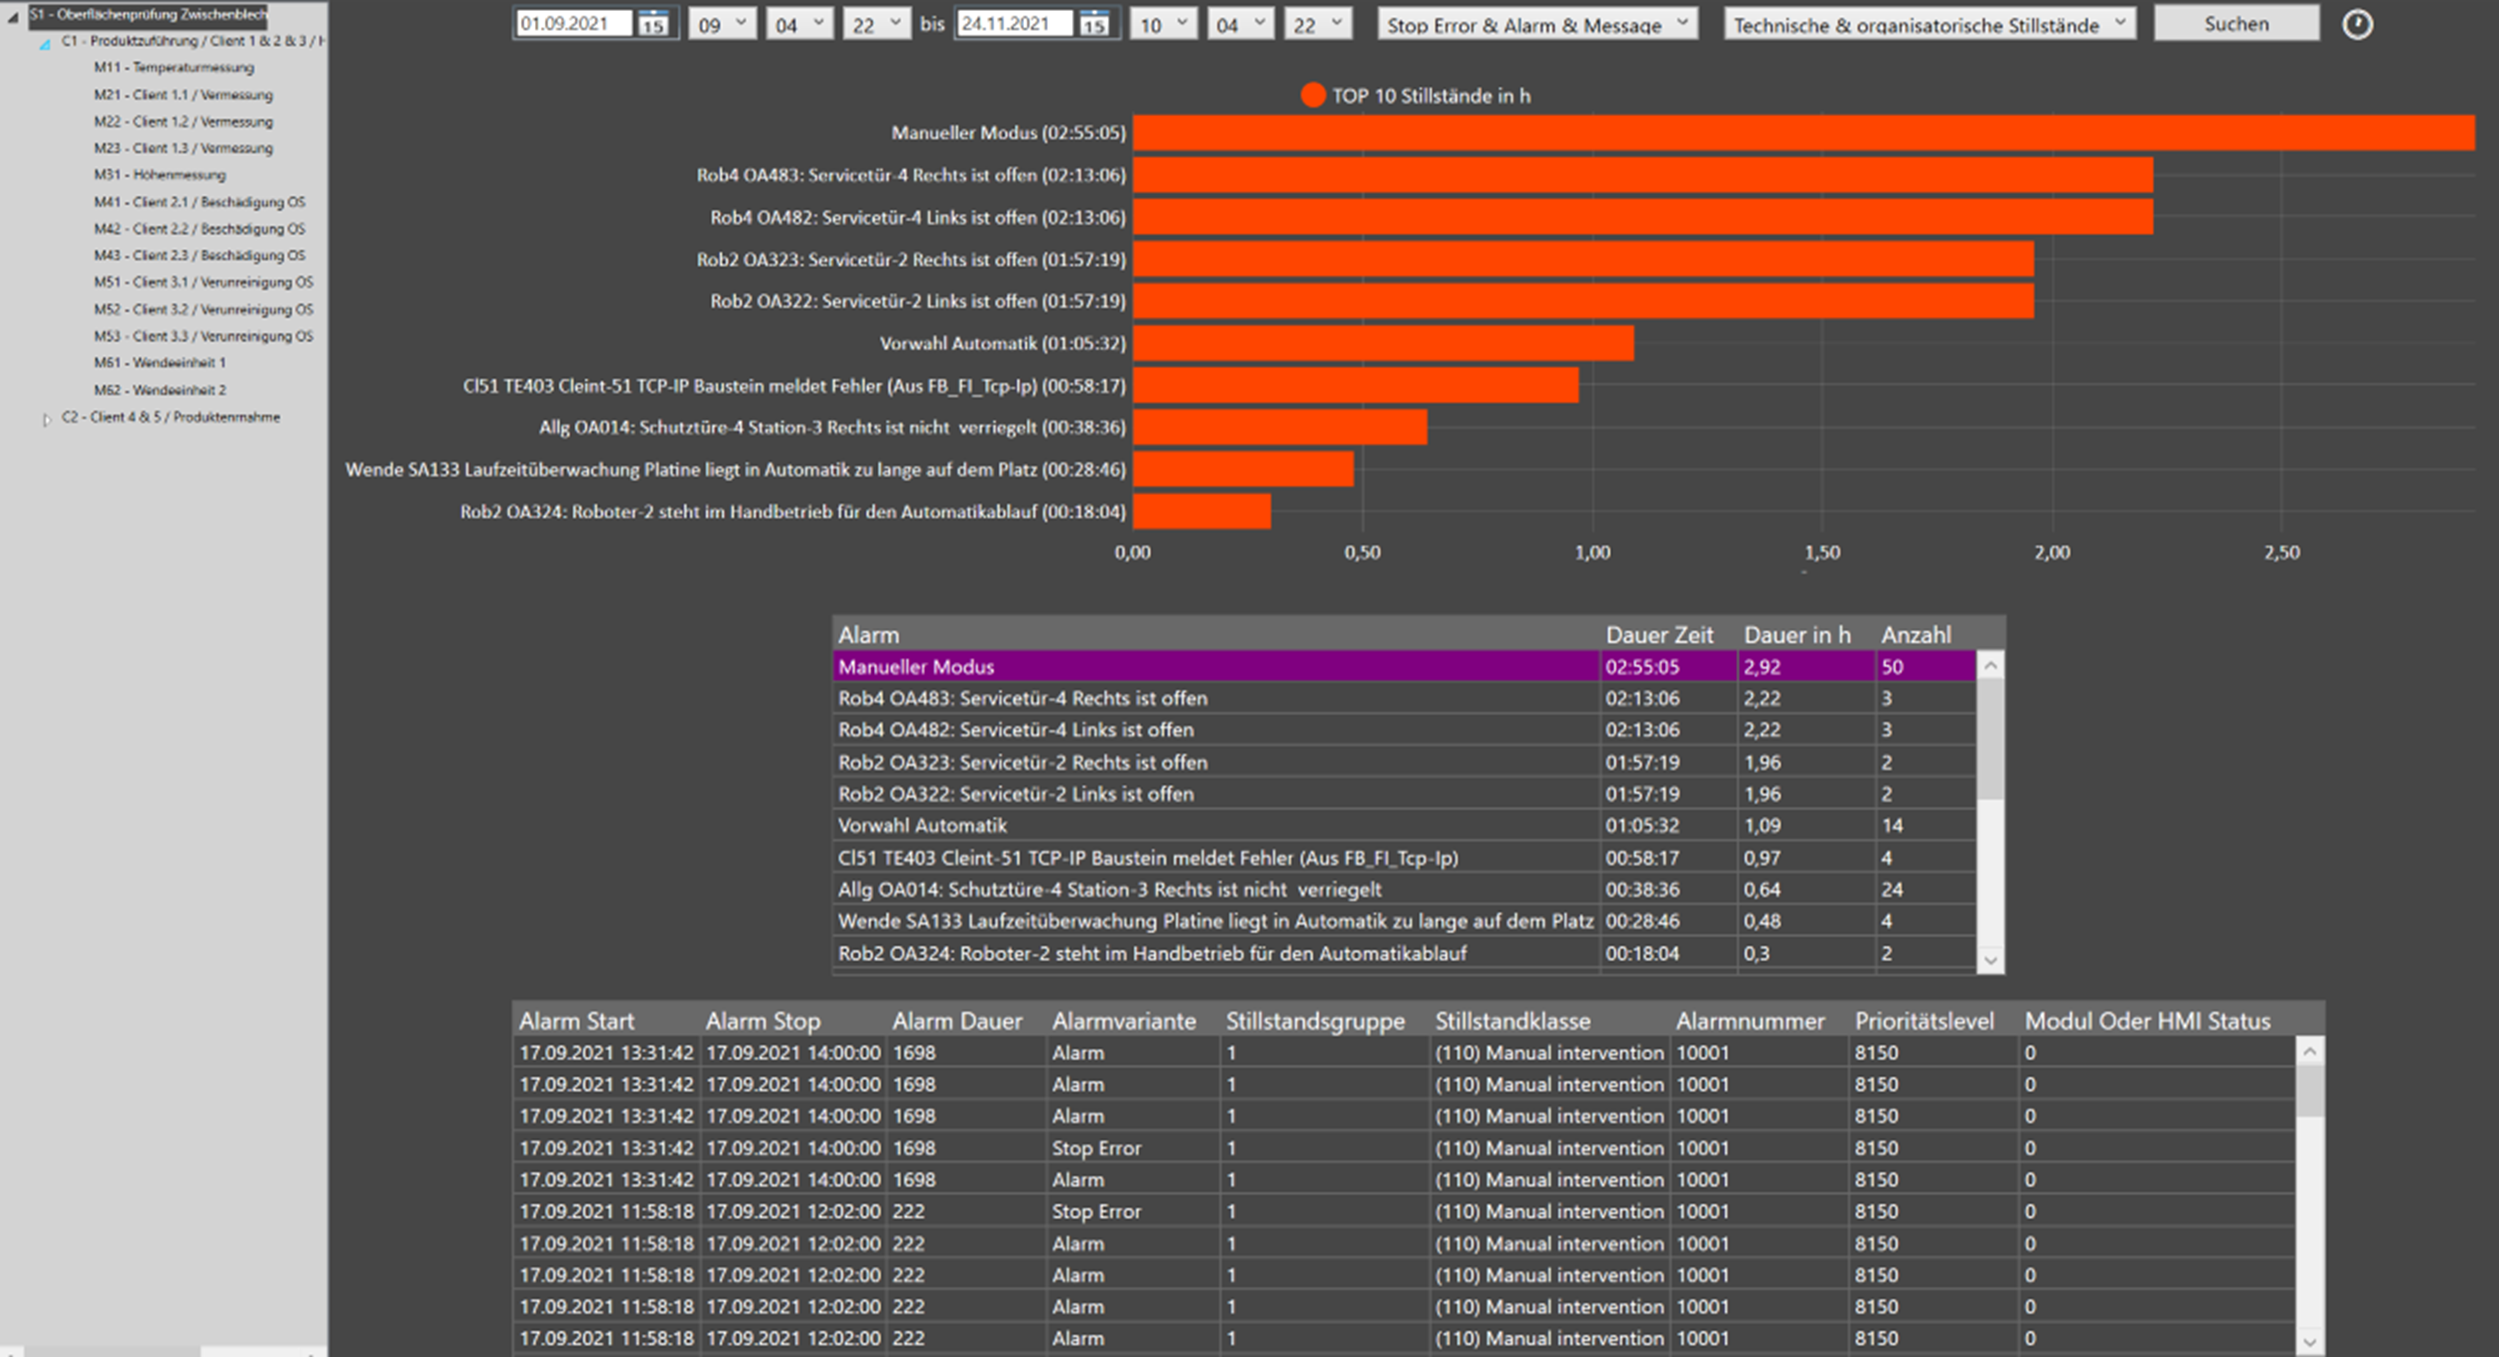
Find out where optimization is still needed with the detailed standstill analysis. Identify organizational and technical problems.
Credentials